mirror of
https://github.com/SeanOMik/ZFS-PrometheusExporter.git
synced 2025-04-15 02:30:37 +00:00
No description
| assets | ||
| src | ||
| .dockerignore | ||
| .gitignore | ||
| Cargo.lock | ||
| Cargo.toml | ||
| dashboard.json | ||
| Dockerfile | ||
| LICENSE | ||
| README.md | ||
| shell.nix | ||
ZFS Prometheus Metrics Exporter
ZFS metrics exporter for Prometheus!
Usage
ZFS metrics exporter for Prometheus!

Usage: zfs_promexporter [OPTIONS]

Options:
  -b, --bind-address <BIND_ADDRESS>  The address to bind and listen from [default: 0.0.0.0]
  -p, --port <PORT>                  The port to listen on [default: 8080]
      --log-level <LOG_LEVEL>        The lowest log level (off, error, warn, info, debug, or trace) [default: info]
  -h, --help                         Print help
  -V, --version                      Print version
Docker
The docker image is a multi-stage build, so its pretty small. You can either build it yourself, or just pull it from GitHub container registry. The image does need to run as privileged so it can collect zfs pool metrics. I'm not sure if there's a way to get it to scrape host zfs pool info without it being privileged.
$ docker pull ghcr.io/seanomik/zfs_promexporter:latest
$ docker run --rm -d --privileged -p 8080:8080 --name zfs_exporter ghcr.io/seanomik/zfs_promexporter:latest
What Metrics Are Exported?
zfs_health(enum): Represents the device's health, can beonline,degraded,faulted,offline,available,unavailableandremoved. The state is stored in thestatelabel, and the value is0for not-in-state, and1for in-state.zfs_read_errors(int gauge): The amount of read errors for this device.zfs_write_errors(int gauge): The amount of write errors for this device.zfs_checksum_errors(int gauge): The amount of checksum errors for this device.zfs_disk_count(int gauge): The amount of disks in this pool or vdev.zfs_vdev_count(int gauge): The amount of vdevs in the pool.zfs_spare_count(int gauge): The spare amount in the pool.zfs_raw_size(int gauge): The raw size (in bytes) of the device. This is not the actual capacity.zfs_capacity(int gauge): The capacity (in bytes) of the device.zfs_available(int gauge): The available bytes of the device.zfs_read_operations(int gauge): The amount of read operations on this device.zfs_write_operations(int gauge): The amount of write operations on this device.zfs_read_bandwidth(int gauge): The read bandwidth for this device in bytes per second.zfs_write_bandwidth(int gauge): The write bandwidth for this device in bytes per second.zfs_fragmentation(int gauge): The percentage (0-100) of fragmentation of the device.
Note: Sizes output from zpool status are in TiB/GiB (1024), not TB/GB (1000).
There are some common labels for the metrics:
device_name: The name of the device that this metric is related to.device_type: The type of the device. Can bepool,vdevordisk.pool: The ZFS pool that this device (vdevordisk) is a part of.
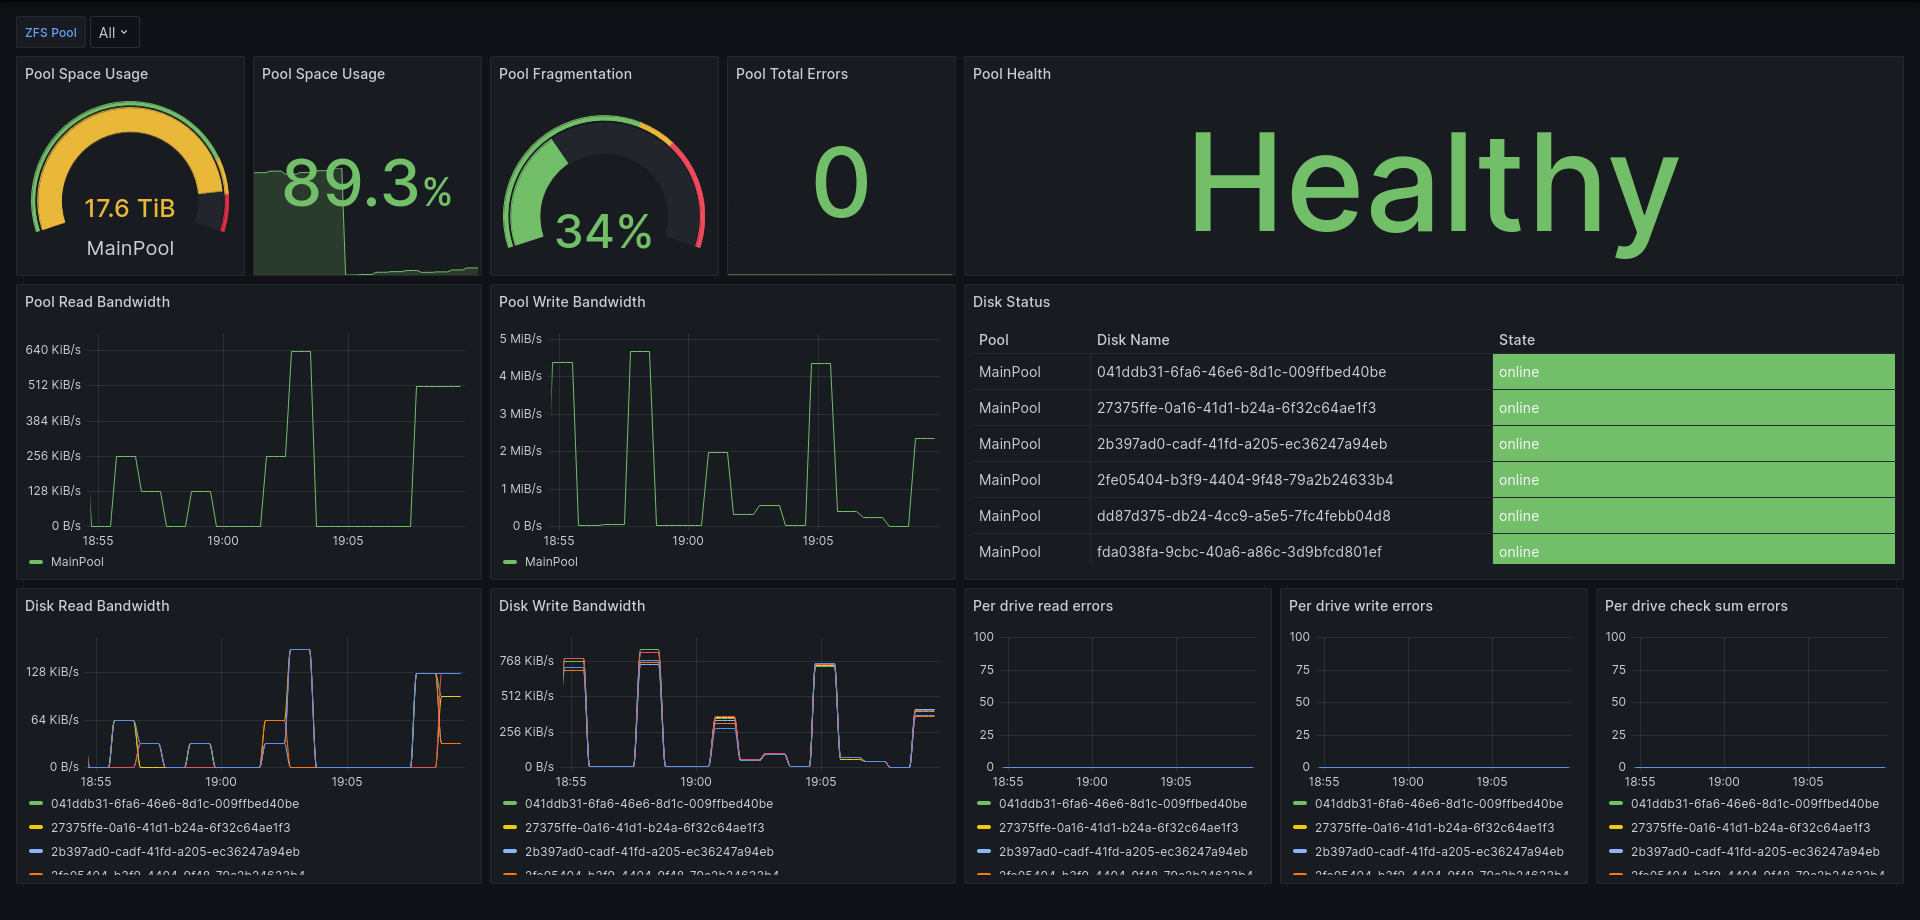
Grafana Dashboard
Import from json: dashboard.json
